Moving Average Cross & Bollinger BandsPut this together for users using the free version of tradingview. Combines MA Cross and Bollinger Bands into one indicator.
在腳本中搜尋"ma cross"
Donchian Channel Alerts R1 by JustUncleLThis idea is based on the Donchain Channel centre line Price action. When price moves from the highest/lowest point, the price will move to the center line first. At this point, the center line acts as dynamic support/resistance and often price will bounce back up. However, if price successfully breaks the centre line (primary entry condition), then prices will tend to catch up to the bottom channel line, many times making further moves in that direction (secondary entry condition).
This script alert idea is designed to be used with Renko (10pip brick recommended) Renko or Heikin Ashi (1 hour recommended) charts. It combines the Donchian Channel centre line price action with a directional coloured EMA (default length 8) to provide entry and exit signals.
There are three options to exit trade:
MA Cross (default exit) = exit occur when price breaks EMA in opposite direction.
Centre Cross = exit occurs when price breaks back passed the centre line in opposite direction.
Brick Colour = exit when a brick/bar paints in the opposite colour to trade direction.
Each Entry and Exit signal creates an Alertcondition that can be picked up by the TradingView Alarm system.
TIPS:
This type of Trading technique only works well in a trending market. Do not try to trade this technique in a ranging/flat market, wait for market to return to trend or pick another pair.
To get 10pip Bricks set Renko to "Traditional" type bricks and 0.001 for non-JPY currency pairs and 0.1 for JPY currency pairs. Also set chart Time frame to 5min or 15mins.
Renko chart:

Candlestick Trend Indicator v0.5 by JustUncleLRequested Update to this Indicator alert project. In this update I have added the option to be able select which Price Action candles you want included in the display and the generated alarm Alert. Other changes also included in this update:
Also added a Price Action candle for "Last Fractal S/R Break", this also a good continuation indication.
Added option to select a different moving average types for directional MA line.
Modified some default settings, using HullMA instead of Zero Lag EMA and standard MACD settings(12,26,9).
Description:
This is a trend following indicator and alert for Binary Options based on Candlestick patterns and trend line -
NOTE: original system was a forex trading system.
This code combines a number of indicators to create an overall trading strategy.
The indicator recognises and displays some useful candle named defined patterns that are used to support trend continuation:
Bearish + Bullish PinBars
Dark Cloud Cover
Piecing Line
Bullish + Bearish Harami
Bullish + Bearish Engulfing Candle
Bullish + Bearish Last Fractal S/R break
Also recognises main Price Action candles from ChrisMoody (CM), the four(4) price action patterns are colored coded bars:
Yellow = Inside Bar - breakout/continuance
Orange = Outside Bar - breakout/continuance
Aqua/Fuschia = Up/Down Shaved Bars - Buying/Selling pressure
Red/Green = Possible reversal PinBars - Reverse Down / reverse Up
The highlighted candles (maroon and darker green) represent the defined PA patterns that have been confirmed following the current trend direction that is indicated by the Hull MA(20) line (can select a different type of MA, or even disable) and confirmed by MACD direction (can be disabled). The confirmed Alerts are indication by green (buy) and red (sell) dots at the bottom of the chart. An alert is generated from this selection for the alert condition of the alarming system.
The fractal upper/lower break lines are also draw, if the (optional) last fractal break line is broken by a highlighted bar then this indicates a stronger trend conformation.
The MACD indicator MACD DEUTER 2 colour(12,26,9) you can visually see the MACD histogram colours with MACD direction - needs "MACD DEUTER 2 colour" indicator.
This multi-indicator set up is suitable for 1hr, 4hr and daily charts with 1-4 candle expiry.
References and Inspiration from:
Fractal Levels by RicardoSantos
Almost Zero Lag EMA
Candlestick Patterns With EMA by rmwaddelljr
CM_Price-Action-Bars by ChrisMoody
www.forexstrategiesresources.com
"Scalp Jockey - MTF MA Cross Visual Strategizer by JayRogers"

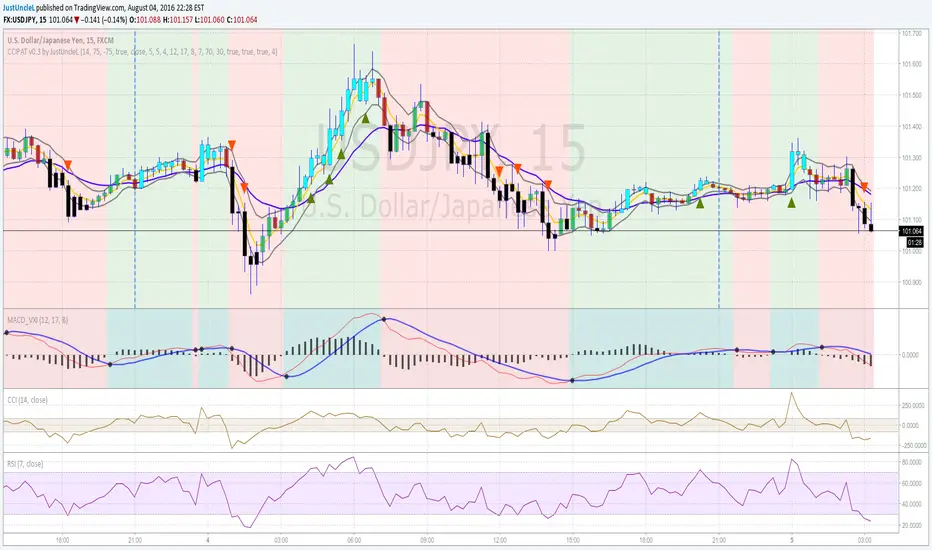
Price Action Trading System v0.3 by JustUncleLThis is an updated and improved version of my "Price Action Trading strategy". I have added two extra optional filters, one is a trend direction filter based on the MACD slow EMA(17), blue line, and the other is a RSI(7) filter which works similarly to CCI(14) but slightly different dynamics (thank you to gianfranco60 for the suggestion). Also made a couple of corrections:
- input for lenLower minval=1 should be maxval=-1
- one bar pullback did not reset trigger, missing some alerts
Some Notes about usage:
- this is an alert indicator not a signal generator, each alert is a strong trend continuance candidate,
but should be treated on it's own merits by looking at chart dynamics and market conditions.
- will work well on trending markets only.
- works best on the first alert after MACD cross over.
- don't take trades when MACD and signal are close together.
- don't trade when channel and slow MA are flat or close together or
chopper (yellow and blue MA cross over quickly over short period).
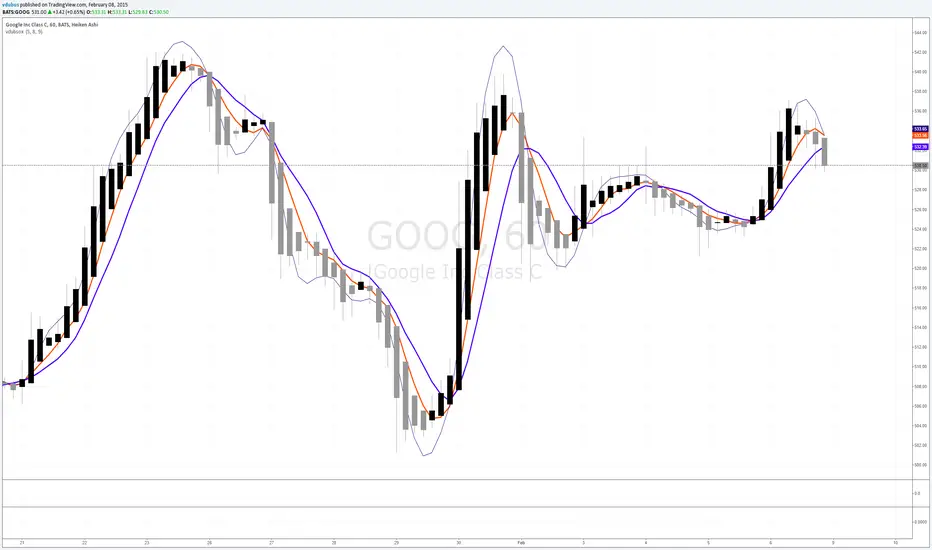
vdubsoxI've been asking for this concept for a while, a simple MA that rides the top side of the trend instead of the bottom, and by accident came across the 'Hull ma' on a TV blog post. I've added another two simple Moving averages to act as strength indicator with close proximity to the price.
The strategy is simple MA cross over but with the early indication using Hull ma gives you a heads up on trend / price reversal.
I'm using this in conjunction with BB set at 34. on a 1/3/5 min charts & Heiken Ashi to smooth out the noise with awesome success trading Binary options.
Algo ۞ Halo 7MAs WonderA complete trend following and important MA crossing tool.
The indicator is self-explanatory. You decide where you want the triggers to go.
Enjoy!

US EU Airlines Basket V2This is a decision engine, not a standard, off-the-shelf indicator full of screaming moon shots, but a multi-faceted system that aggregates data from an entire sector (US and EU Airlines) and combines it with macroeconomic factors (USD and Oil prices) and standard technical tools (Moving Averages, RSI, Volume, Supply/Demand Zones). This system draws from current sentiment with a lookback to match similar fundamental data historically to provide a potential price movement range estimation within the current viewable timeframe.
💡 Overview of the Indicator
The script, titled "US & EU Airlines Basket Analysis - DUAL SENTIMENT (Anchored Projection)," is an effort to create a holistic trading signal specifically for the airline industry.
It uses a "Basket Analysis" approach, which means it calculates the aggregate sentiment of a group of related stocks rather than just the stock it's currently plotted on. The core idea is that the overall health of the airline sector (US vs. EU) is a stronger signal than the analysis of a single airline stock.
🏗️ Core Structure and Ideas
The script's structure is modular and highly sophisticated, incorporating several distinct trading concepts:
Dual Basket Sentiment (The Core Idea)
It pulls 7 eu airline stocks and 7 us airline stocks
• Anchored Plot: The most innovative visualization feature is the Dual Combined Sentiment Plot. It plots the two regional sentiment scores as lines that are vertically "anchored" to a percentage of the visible chart range
2. Multi-Factor Sentiment Aggregation
The final sentiment index for US and EU is not purely based on MA crosses but is a weighted score incorporating multiple indices and commodities/oil and currency weighted factors, which is a sign of robust and well-thought-out logic.
How to use:
Observe the two sentiment EU US lines (they’re self explanatory and the backbone of the system).
Discoverable factors: global trends, local Country trends, fragmented market trends.
Tags EU US (w for weak) (m for medium) (s for strong) numbers 1 to 7 occur in any instance on a bar where one of the 7 stocks of a basket experienced a heavy buying or selling event.
🟡 Yellow Bars (Inverse Correlation)
The yellow bars signal a period where the airline basket and the price of oil are moving in a strong inverse direction (as expected).
• Condition: They appear when one of two inverse scenarios is met on the specified oil_inflection_timeframe (default is Daily):
1. Oil Rises significantly (above oil_change_threshold) AND the Airlines Fall significantly (below -airline_change_threshold).
2. Oil Falls significantly (below -oil_change_threshold) AND the Airlines Rise significantly (above airline_change_threshold).
🔵 Blue/Cyan Bars (Direct Correlation)
The blue/cyan bars signal a period where the airline basket and the price of oil are moving in a strong direct direction, which is an unusual/non-traditional relationship.
• Condition: They appear when the movement of the two assets is in the same strong direction:
1. Oil Rises significantly AND the Airlines Rise significantly.
2. Oil Falls significantly AND the Airlines Fall significantly.
White bar right side of screen: This is a standard lookback average bar with customisable lookback length in setting.
Blue and yellow horizontal lines right side..
Blue is US with estimated price range based on us sentiment line, also accompanied by a derived lookback dotted line “US LB”
Green horizontal line is EU estimated price range based on EU sentiment line also accompanied by a derived lookback dotted line “EU LB”.
The dotted line of EU and US simply displays to the user how far back we are looking in relation to the right side solid blue and green horizontal price estimate lines.
Grey box: Definitive market conditions in % if the air sector is moving neutral with or against the petrodollar.

SibayakNa - v16.1 Entry Setup Indicator to confirm Entry Setup with simple MA Crossing, RSI, Volume, ATR, OBV, ADX at MTF.


Dominance Signal Apex [CHE]]Dominance Signal Apex — Triple-confirmed entry markers with stateful guardrails
Summary
This indicator focuses on entry timing by plotting markers only when three conditions align: a closed-bar Heikin-Ashi bias, a monotonic stack of super-smoother filters, and the current HMA slope. A compact state machine provides guardrails: it starts a directional state on closed-bar Heikin-Ashi bias, maintains it only while the smoother stack remains ordered, and renders a marker only if HMA slope agrees. This design aims for selective signals and reduces isolated prints during mixed conditions. Markers fade over time to visualize the age and persistence of the current state.
Motivation: Why this design?
Common triggers flip frequently in noise or react late when regimes shift. The core idea is to gate entry markers through a closed-bar state plus independent filter alignment. The state machine limits premature prints, removes markers when alignment breaks, and uses the HMA as a final directional gate. The result is fewer mixed-context entries and clearer clusters during sustained trends.
What’s different vs. standard approaches?
Reference baseline: Single moving-average slope or classic MA cross signals.
Architecture differences:
Multi-length two-pole super-smoother stack with strict ordering checks.
Closed-bar Heikin-Ashi bias to start a directional state.
HMA slope as a final gate for rendering markers.
Time-based alpha fade to surface state age.
Practical effect: Entry markers appear in clusters during aligned regimes and are suppressed when conditions diverge, improving selectivity.
How it works (technical)
Measurements: Four recursive super-smoother series on price at short to medium horizons. Up regime means each shorter smoother sits below the next longer one; down regime is the inverse.
State machine: On bar close, positive Heikin-Ashi bias starts a bull state and negative bias starts a bear state. The state terminates the moment the smoother ordering breaks relative to the prior bar.
Rendering gate: A marker prints only if the active state agrees with the current HMA slope. The HMA is plotted and colored by slope for context.
Normalization and clamping: Marker transparency transitions from a starting to an ending alpha across a fixed number of bars, clamped within the allowed range.
Initialization: Persistent variables track state and bar-count since state start; Heikin-Ashi open is seeded on the first valid bar.
HTF/security: None used. State updates are closed-bar, which reduces repaint paths.
Bands: Smoothed high, low, centerline, and offset bands are computed but not rendered.
Parameter Guide
Show Markers — Toggle rendering — Default: true — Hides markers without changing logic.
Bull Color / Bear Color — Visual colors — Defaults: bright green / red — Aesthetic only.
Start Alpha / End Alpha — Transparency range — Defaults: one hundred / fifty, within zero to one hundred — Controls initial visibility and fade endpoint.
Steps — Fade length in bars — Default: eight, minimum one — Longer values extend the visual memory of a state.
Smoother Length — Internal band smoothing — Default: twenty-one, minimum two — Affects computed bands only; not drawn.
Band Multiplier — Internal band offset — Default: one point zero — No impact on markers.
Source — Input for HMA — Default: close — Align with your workflow.
Length — HMA length — Default: fifty, minimum one — Larger values reduce flips; smaller values react faster.
Reading & Interpretation
Entry markers:
Bull marker (below bar): Closed-bar Heikin-Ashi bias is positive, smoother stack remains aligned for up regime, and HMA slope is rising.
Bear marker (above bar): Closed-bar Heikin-Ashi bias is negative, smoother stack remains aligned for down regime, and HMA slope is falling.
Fade: Transparency progresses over the configured steps, indicating how long the current state has persisted.
Practical Workflows & Combinations
Trend following: Focus on marker clusters aligned with HMA color. Add structure filters such as higher highs and higher lows or lower highs and lower lows to avoid counter-trend entries.
Exits/Stops: Consider exiting or reducing risk when smoother ordering breaks, when HMA color flips, or when marker cadence thins out.
Multi-asset/Multi-TF: Suitable for liquid crypto, FX, indices, and equities. On lower timeframes, shorten HMA length and fade steps for faster response.
Behavior, Constraints & Performance
Repaint/confirmation: State transitions and marker eligibility are decided on closed bars; live bars do not commit state changes until close.
security()/HTF: Not used.
Resources: Declared max bars back of one thousand five hundred; recursive filters and persistent states; no explicit loops.
Known limits: Some delay around sharp turns; brief states may start in noisy phases but are quickly revoked when alignment fails; HMA gating can miss very early reversals.
Sensible Defaults & Quick Tuning
Start here: Keep defaults.
Too many flips: Increase HMA length and raise fade steps.
Too sluggish: Decrease HMA length and reduce fade steps.
Markers too faint/bold: Adjust start and end alpha toward lower or higher opacity.
What this indicator is—and isn’t
A selective entry-marker layer that prints only under triple confirmation with stateful guardrails. It is not a full system, not predictive, and does not handle risk. Combine with market structure, risk controls, and position management.
Disclaimer
The content provided, including all code and materials, is strictly for educational and informational purposes only. It is not intended as, and should not be interpreted as, financial advice, a recommendation to buy or sell any financial instrument, or an offer of any financial product or service. All strategies, tools, and examples discussed are provided for illustrative purposes to demonstrate coding techniques and the functionality of Pine Script within a trading context.
Any results from strategies or tools provided are hypothetical, and past performance is not indicative of future results. Trading and investing involve high risk, including the potential loss of principal, and may not be suitable for all individuals. Before making any trading decisions, please consult with a qualified financial professional to understand the risks involved.
By using this script, you acknowledge and agree that any trading decisions are made solely at your discretion and risk.
Best regards and happy trading
Chervolino


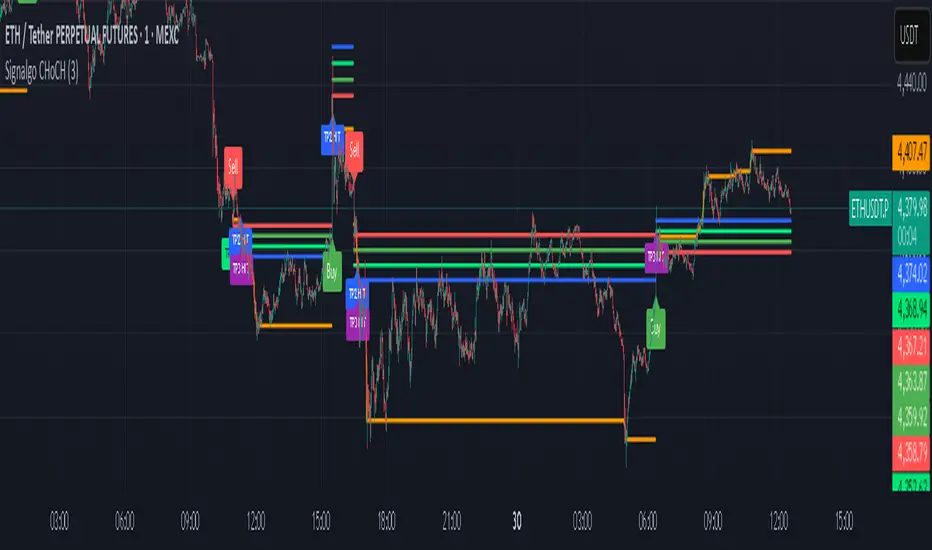
Signalgo CHoCHSignalgo CHoCH: Informative Technical Overview
Signalgo CHoCH is a multi-factor indicator designed for TradingView to detect “Change of Character” (CHoCH) shifts in market structure, signaling significant trend reversals and managing trades with risk control. This documentation details how it operates, its customizable parameters, signal methodology, what makes it different from traditional tools, and typical strategy applications.
How Signalgo CHoCH Works
1. Market Structure Detection
Swing High & Low Identification: The indicator uses an adaptive swing length to isolate important pivot highs and lows in price action. These pivots signal points where the market reversed direction or paused, forming the “swing structure” core to this strategy.
Body Strength Validation: Not every pivot break is meaningful. Signalgo CHoCH assesses price bar “body strength”—quantifying if the current candle’s body is disproportionately large compared to a recent average—to filter out weak or indecisive moves, retaining only those breaks likely to indicate genuine momentum.
2. Change of Character (CHoCH) Signal Logic
Bullish CHoCH: Triggered when price closes above the last significant swing low (the most recent support) with a strong candle body, indicating a transition from bearish to bullish market structure.
Bearish CHoCH: Triggered when price closes below the last significant swing high (key resistance) with a strong bearish candle, denoting a shift from bullish to bearish structure.
One-Time Event Recognition: Each break is tracked so that signals are issued only once per directional change, reducing repeated or redundant entries.
3. Higher Timeframe Confirmation
Multi-Timeframe Consistency: The indicator requires the CHoCH signal (on the current trading timeframe) to be confirmed by the market structure status of a selected higher timeframe. This adds an extra layer of validation, ensuring the signal aligns with broader trends.
Inputs
SwingLen: The number of bars used to define swing pivots.
bodyStrength & bodyLookback: Control sensitivity for body size validation, filtering which candle breaks are considered strong enough for signaling.
htfTf: Selects the higher timeframe for multi-timeframe checking.
show_tpsl: Toggle to show/hide automated Take Profit (TP) and Stop Loss (SL) levels on the chart.
ATR, TP/SL/RR/Trailing Settings: Determines how risk and reward are managed, using ATR for stop placement and multi-level profit targets with optional trailing stop activation after TP1.
Entry & Exit Strategy
Entry Logic
Long Entry: When a bullish CHoCH is detected, optionally confirmed by the higher timeframe, it marks a buy opportunity at the close of the breakout candle.
Short Entry: When a bearish CHoCH forms, also with optional higher timeframe confirmation, it identifies a sell entry at the close of the confirmation candle.
Exit & Trade Management
Stop Loss (SL): Automatically placed at a set ATR distance from entry, dynamically adapting to volatility.
Take Profits (TP1, TP2, TP3): Multiple reward targets are calculated and marked for systematic scaling out or profit-taking, based on a defined risk multiple.
Trailing Stop: Once the first profit target is hit, SL moves to breakeven, and a trailing stop engages, incrementally securing further gains if the trend continues.
State Tracking: All TP, SL, and trailing events are labeled on the chart for easy post-trade analysis.
Body Strength and Trend Filtering: Breakouts are only considered if the candle’s body confirms significant momentum, not just a fleeting spike, improving signal quality.
Event-Driven, Not Rolling: Each bullish or bearish “character change” is signaled only at the true point of structural shift, with strict per-event marking, not continuous signal generation as with typical MA cross strategies.
Integrated Multi-Timeframe Logic: higher timeframe validation minimizes false positives from short-term volatility noise, a capability not found in most indicator-based tools.
Automated, Dynamic Trade Management: This indicator overlays a complete trade management suite (TPs, SL, trailing) that moves with market conditions, allowing for risk handling directly from each signal.
Trading Strategy Application
Trend Reversal & Continuation: Suitable for identifying both sudden reversals and structural continuations, adaptable for intraday, swing, or positional trading styles.
Noise Filtering: Multiple checks (body strength, momentum, multi-timeframe) focus signals on genuine trend changes, filtering out most “whipsaws” seen in pure MA systems.
Visual Feedback: All transitions, TPs, SLs, and trailing events are visually annotated, enhancing the educational and review process.
Multi-Asset Trend Background [SwissAlgo]Multi-Asset Trend Background
---------------------------------------------------------
Purpose
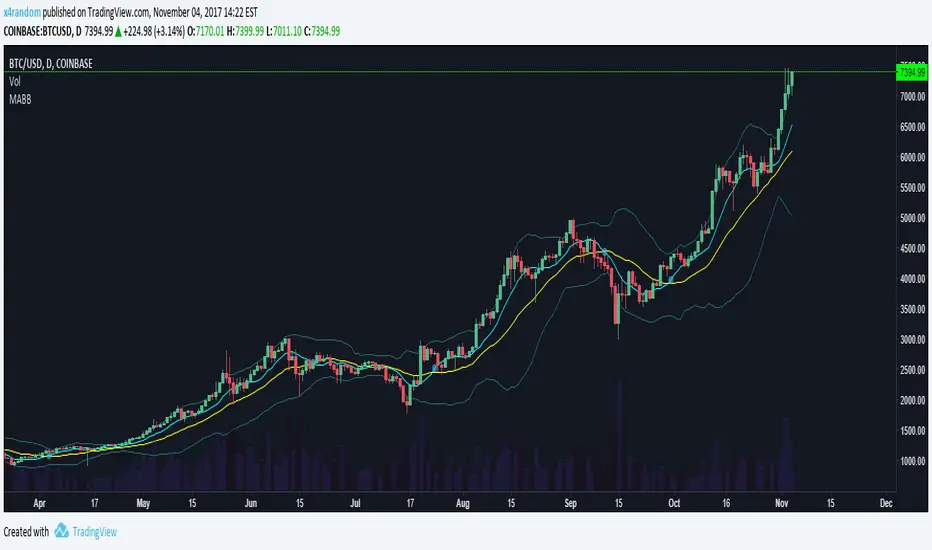
This indicator colors the chart background green (uptrend) or red (downtrend) to show the broad phases of a selected asset or ratio (for example SP500, or Gold), regardless of the current ticker on the chart (for example BTC).
The aim is not to generate signals, but to show when the selected asset (such as SP500 or Gold) was in a sustained uptrend or downtrend, so you can compare another chart (for example BTC) against that backdrop.
It helps frame price action in context, highlighting how macro drivers often align with or diverge from other markets.
From mid-2016 to late-2017, the SP500 was in a clear uptrend — Bitcoin rallied strongly in the same period, showing alignment between equities and crypto risk-taking.
When Gold trended higher, the SP500 often weakened, reflecting their tendency to move inversely in longer cycles.
As HYG/TLT turned down in early 2020, QQQ also struggled — illustrating how credit risk appetite is linked to equity performance.
During periods of DXY strength, Gold frequently showed the opposite trend, consistent with the historical dollar–gold relationship.
When RSP/SPY trended down, rallies in the S&P 500 were driven by a narrow group of large-cap stocks, while a rising ratio indicated broad market participation.
---------------------------------------------------------
Why it May Help You
Provides context for asset correlations.
Helps identify whether a chart is moving with or against its macro environment.
Useful for cycle mapping and historical study of market phases.
Filters noise and emphasizes established trends rather than short swings.
---------------------------------------------------------
How it Works
You select an asset or ratio from a dropdown.
The script calculates a mid-term moving average, then measures its slope, slope change, and slope acceleration to quantify the trend’s direction and consistency.
A longer-term moving average filter defines whether the long-term backdrop is bullish or bearish.
Background Coloring rules:
Green = slope strongly positive in line with long-term uptrend, or downtrend showing constructive reversal signs.
Red = slope strongly negative in line with long-term downtrend, or uptrend showing weakening slope.
No shading = neutral or mixed conditions.
This slope-based approach avoids the limitations of simple MA crosses, aiming to capture broad, consistent trend phases across different assets, with a mid/long-term view.
---------------------------------------------------------
Assets You Can Select
EQUITIES – good reference to gauge risk appetite in financial markets
SP500 = broad benchmark. Uptrend = strength in US equities signalling risk-on conditions; downtrend = weakness, risk-off market phase.
NASDAQ = tech and growth stocks. Uptrend = technology/growth leadership, risk appetite; downtrend = tech underperformance and fading risk appetite.
DOW = industrial and value stocks. Uptrend = industrial/value strength/economic strength; downtrend = weakness in traditional sectors and potential economic downturn.
RUSSELL2000 = small caps. Uptrend = typical in risk-on environments and FOMO; downtrend = small-cap underperformance, "flight to safety".
COMMODITIES – proxies for inflation, industry, and safe-haven demand.
GOLD = safe-haven. Uptrend = defensive demand rising/risk-off/inflation fears; downtrend = weaker demand for safety.
SILVER = partly industrial, partly safe-haven. Uptrend = stronger industrial cycle, or precious metals demand and risk appetite.
COPPER = industrial barometer. Uptrend = stronger industrial activity; downtrend = economic slowdown concerns.
CRUDE OIL = energy prices. Uptrend = rising energy/inflation pressures; downtrend = weaker demand or supply relief.
NATURAL GAS = volatile energy prices. Uptrend = higher energy costs and inflation pressure; downtrend = easing energy conditions.
BONDS / FX – monetary policy, credit, and risk appetite signals.
TLT = long-term US bonds. Uptrend = falling yields (bond demand)/flight to safety; downtrend = rising yields (risk on)
HYG = high-yield credit. Uptrend = strong credit appetite; downtrend = risk aversion in credit markets.
DXY = US dollar index. Uptrend = dollar strength (weaker EUR, GBP, SEK, etc); downtrend = dollar weakness.
USDJPY = carry trade proxy. Uptrend = stronger USD vs JPY (risk appetite); downtrend = JPY strength (risk-off).
CHFUSD = Swiss franc. Uptrend = franc strength (defensive flow); downtrend = franc weakness.
YIELD INVERSION = US10Y–US02Y. Uptrend = curve steepening; downtrend = inversion deepening (higher recession risk).
HOME BUILDERS = US housing sector. Uptrend = housing sector strength (risk on); downtrend = weakness (risk off).
EURUSD = euro vs dollar. Uptrend = euro strength (risk appetite); downtrend = euro weakness (risk aversion).
CRYPTO – digital asset benchmarks.
BITCOIN = digital gold. Uptrend = BTC strength; downtrend = BTC weakness.
CRYPTO_TOTAL = entire crypto market cap. Uptrend = broad crypto growth; downtrend = contraction.
CRYPTO_ALTS = altcoin market cap. Uptrend = altcoin expansion (often “alt season”); downtrend = contraction.
RATIOS – relative measures to extract macro signals.
COPPER/BTC = compares industrial cycle vs Bitcoin cycle. Uptrend = copper outperforming BTC; downtrend = BTC outperforming copper. Seems aligned with BTC macro tops and bottoms in the mid/long run.
RSP/SPY = market breadth (equal-weight vs cap-weighted). Uptrend = strong broad participation in market growth; downtrend = narrow leadership (fewer stocks leading the growth).
PCE/CPI = Fed’s inflation measure (PCE) vs consumer perceived inflation (CPI). Uptrend = PCE rising faster than CPI; downtrend = CPI running hotter than PCE. Fluctuates around 1; values above 1 may indicate hawkish Fed stands, values < 1 may indicate more dovish Fed stands.
HYG/TLT = credit vs bonds. Uptrend = risk appetite (high-yield outperforming long-term
treasury bonds); downtrend = risk aversion.
GOLD/SILVER = defensive vs cyclical metals. Uptrend = gold outperforming (risk-off tilt); downtrend = silver outperforming (risk-on tilt).
EURUSD/BTC = fiat vs crypto. Uptrend = EUR strengthening vs BTC; downtrend = BTC strengthening vs EUR. In general, the BTC trend is aligned EUR/USD trend.
---------------------------------------------------------
Limitations
Trend detection may lag by design to reduce noise.
Ratios rely on the availability and session rules of their components.
Background colors update on bar close; intra-bar values may differ.
Parameters are fixed and may not suit all assets equally.
---------------------------------------------------------
Disclaimer
This script is for educational and research purposes only. It does not provide financial advice or trade recommendations. Historical trend alignment does not guarantee future outcomes. Use with additional independent analysis.

Bearish Breakaway Dual Session-FVGInspired by the FVG Concept:
This indicator is built on the Fair Value Gap (FVG) concept, with a focus on Consolidated FVG. Unlike traditional FVGs, this version only works within a defined session (e.g., ETH 18:00–17:00 or RTH 09:30–16:00).
See the Figure below as an example:
Bearish consolidated FVG & Bearish breakaway candle
Begins when a new intraday high is printed. After that, the indicator searches for the 1st bearish breakaway candle, which must have its high below the low of the intraday high candle. Any candles in between are part of the consolidated FVG zone. Once the 1st breakaway forms, the indicator will shades the candle’s range (high to low). Then it will use this candle as an anchor to search for the 2nd, 3rd, etc. breakaways until the session ends.
Session Reset: Occurs at session close.
Repaint Behavior:
If a new intraday (or intra-session) high forms, earlier breakaway patterns are wiped, and the system restarts from the new low.
Counter:
A session-based counter at the top of the chart displays how many bullish consolidated FVGs have formed.
Settings
• Session Setup:
Choose ETH, RTH, or custom session. The indicator is designed for CME futures in New York timezone, but can be adjusted for other markets.
If nothing appears on your chart, check if you loaded it during an inactive session (e.g., weekend/Friday night).
• Max Zones to Show:
Default = 3 (recommended). You can increase, but 3 zones are usually most useful.
• Timeframe:
Best on 1m, 5m, or 15m. (If session range is big, try higher time frame)
Usage:
See this figure as an example
1. Avoid Trading in Wrong Direction
• No Bearish breakaway = No Short trade.
• Prevents the temptation to countertrade in strong uptrends.
2. Catch the Trend Reversal
• When a bearish breakaway appears after an intraday high, it signals a potential reversal.
• You will need adjust position sizing, watch out liquidity hunt, and place stop loss.
• Best entries of your preferred choices: (this is your own trading edge)
Retest
Breakout
Engulf
MA cross over
Whatever your favorite approach
• Reversal signal is the strongest when price stays within/below the breakaway candle’s
range. Weak if it breaks above.
3. Higher Timeframe Confirmation
• 1m can give false reversals if new lows keep forming.
• 5m often provides cleaner signals and avoids premature reversals.
Summary
This indicator offers 3 main advantages:
1. Prevents wrong-direction trades.
2. Confirms trend entry after reversal signals.
3. Filters false positives using higher timeframes.
Failed example:
Usually happen if you are countering a strong trend too early and using 1m time frame
Last Mention:
The indicator is only used for bearish side trading.

Bullish Breakaway Dual Session-Publish-Consolidated FVG
Inspired by the FVG Concept:
This indicator is built on the Fair Value Gap (FVG) concept, with a focus on Consolidated FVG. Unlike traditional FVGs, this version only works within a defined session (e.g., ETH 18:00–17:00 or RTH 09:30–16:00).
Bullish consolidated FVG & Bullish breakaway candle
Begins when a new intraday low is printed. After that, the indicator searches for the 1st bullish breakaway candle, which must have its low above the high of the intraday low candle. Any candles in between are part of the consolidated FVG zone. Once the 1st breakaway forms, the indicator will shades the candle’s range (high to low). Then it will use this candle as an anchor to search for the 2nd, 3rd, etc. breakaways until the session ends.
Session Reset: Occurs at session close.
Repaint Behavior:
If a new intraday (or intra-session) low forms, earlier breakaway patterns are wiped, and the system restarts from the new low.
Counter:
A session-based counter at the top of the chart displays how many bullish consolidated FVGs have formed.
Settings
• Session Setup:
Choose ETH, RTH, or custom session. The indicator is designed for CME futures in New York timezone, but can be adjusted for other markets.
If nothing appears on your chart, check if you loaded it during an inactive session (e.g., weekend/Friday night).
• Max Zones to Show:
Default = 3 (recommended). You can increase, but 3 zones are usually most useful.
• Timeframe:
Best on 1m, 5m, or 15m. (If session range is big, try higher time frame)
Usage
1. Avoid Trading in Wrong Direction
• No bullish breakaway = No long trade.
• Prevents the temptation to countertrade in strong downtrends.
2. Catch the Trend Reversal
• When a bullish breakaway appears after an intraday low, it signals a potential reversal.
• You will need adjust position sizing, watch out liquidity hunt, and place stop loss.
• Best entries of your preferred choices: (this is your own trading edge)
Retest
Breakout
Engulf
MA cross over
Whatever your favorite approach
• Reversal signal is the strongest when price stays within/above the breakaway candle’s
range. Weak if it breaks below.
3. Higher Timeframe Confirmation
• 1m can give false reversals if new lows keep forming.
• 5m often provides cleaner signals and avoids premature reversals.
Failed Trade Example:
This indicator will repaint if a new intraday session low is updated. So it is possible to have a failed trade. Here is an example from the same session in 1m chart. However, if you enter the trade later at another bullish breakaway candle signal. The loss can be mitigated by the profit.
Therefore you should use smaller position size for your 1st trade. You should also considering using 5m chart to avoid 1m bull trap. In this example, if you use 5m chart, you can totally avoid this failed trade.
If you enter the trade, you will see the intraday low is stop loss hunted. You can also see the 1st bullish breakaway candle is super weak. There are a lot of candles below the breakaway candle low, so it is very possible to fail.
In the next chart, you can see the failed traded get stop loss hunted. However you can enter another trade with huge profit to win back the loss from the 1st trade if you follow the rule.
Summary
This indicator offers 3 main advantages:
1. Prevents wrong-direction trades.
2. Confirms trend entry after reversal signals.
3. Filters false positives using higher timeframes.
How to sharp your edge:
1. ⏳Extreme patience⏳: Do not guess the bottom during a downtrend before a confirmed bullish breakaway candle. If you get caught, have the courage to cut loss. This is literally the most important usage of this indicator. Again, this is the most important rule of this indicator and actually the hardest rule to follow.
2. 🛎Better Entry🛎: After a confirmed bullish breakaway, you will always have a good opportunity to enter the trade using established trading technique. Your edge will come from the position size, draw down, stop loss placement, risk/reward ratio.
3. ✂Cut loss fast✂: If you enter a trade according to the rule, but you are still not making profit for a period of time, and the price is below the low of the breakaway candle. It is very likely you may hit stop loss soon (intraday session low). It won't be a bad idea to cut loss before stop loss hit.
4. 🔂Reentry with confidence after stop loss🔂: a stop loss will not invalidate the indicator. If you see a second chance to reenter, you should still follow the trade guide and rule.
5. 🕔Time frame matter🕔: try 1m, 3m, 5m, 10m, 15m time frame. Over time, you should know what time frame work best for you and the market. Higher time frame will reduce the noise of false positive trade, but it comes with a higher stop loss placement and less max profit, however it may come with a lower draw down. Time frame will matter depending on the range of the session. If the session range is small (<0.5%), lower time frame is good. If session range is big (>1%), 5m time frame is better. Remember to wait for candle to close, if you use higher time frame.
Last Mention:
The indicator is only used for bullish side trading.

Pineify Signals and OverlaysIndicator Theoretical Basis
Pineify Signals and Overlays is an invite-only trend-following and reversal-detection toolkit that fuses four well-known concepts— Dow-Theory trend phases , a multi-pair EMA cloud, QQE momentum, and ATR-based risk management—into a single, weight-balanced engine. An optional multi-time-frame (MTF) filter aligns lower-time-frame signals with higher-time-frame structure, helping traders avoid counter-trend setups. All components can be toggled from the settings panel, and a beginner “One-Click” preset loads a conservative profile out of the box.
Why it’s a single script: The algorithm scores every bar on three orthogonal axes—trend, momentum, and volatility—then issues context-aware arrows and coloured clouds only when the axes agree within user-defined tolerances. This inter-locking logic cannot be reproduced by simply stacking independent indicators on a chart, hence the need for an integrated implementation.
Trend Confirmation
Trend Confirmation: This indicator presents two types of market trends: the primary trend and the secondary trend. The primary trend is the long - term direction of the market and can last for days or months; the secondary trend is the adjustment phase within the primary trend.
This indicator uses the EMA (Exponential Moving Average) and visualizes the trend phases through color filling. The judgment of the trend is that blue plus green indicates a bullish trend, and yellow plus red indicates a bearish trend.
The primary trend of this indicator is visualized by two sets of moving averages through color filling. These two sets of moving averages are used to describe the short - term and long - term trends in the market.
The short - period moving averages and the long - period moving averages each consist of 4 moving averages, with a total of 8 moving averages, representing the short - term fluctuations and trends of the market.
Trend Persistence: Once the primary trend is formed, it will persist for a period of time. This indicator judges based on the Dow Theory. Short - term market fluctuations do not necessarily reflect changes in the primary trend. Therefore, the judgment direction of the primary trend is visualized through color.
The Signals of Buying, Selling and Closing
In the primary trend, we can see signals of trend reversal. This indicator incorporates the "Consecutive Candles". The indicator mainly identifies the overbought or oversold state of the market through a series of consecutive conditions, so as to predict the reversal point. The core of this indicator is to identify a series of consecutive price movements in the market trend and determine whether the market is about to reverse based on this sequence. We visualize the turning points through buy and sell signals.
The trend confirmation system utilizes four pairs of Exponential Moving Averages (EMAs) creating dynamic cloud formations that visualize market direction. Short-period EMAs (5, 8, 20, 34) interact with longer-period EMAs (9, 13, 21, 50) to generate color-coded trend clouds . Blue and green clouds indicate bullish conditions, while yellow and red clouds signal bearish trends, providing immediate visual trend identification.
The presentation of buying and selling points, namely "Quantitative Qualitative Estimation", is a technical indicator that combines the concepts of the Relative Strength Index (RSI) and moving averages. It is used to evaluate market trends, overbought and oversold conditions, as well as potential trend reversal points. The oscillator has a relatively long smoothing period, making the indicator relatively stable, thus enabling the visualization of buy + and sell + signals for trading.
ATR Stop - Loss Line
ATR (Average True Range) is an indicator for measuring market volatility. By using the ATR value to set the stop - loss distance, the stop - loss level can be automatically adjusted according to market volatility, making the stop - loss more flexible.
Core principle
Trend-Cloud Engine
EMA Pairs (5, 8, 20, 34 vs 9, 13, 21, 50)—Two four-EMA sets form “fast” and “slow” envelopes. When the volume-weighted mean of the fast set sits above the slow set and both slopes are positive, the bar is tagged primary bullish; the inverse tags primary bearish. Cloud colours (blue/green vs yellow/red) mirror Dow Theory’s primary/secondary trend hierarchy.
Momentum & Exhaustion Layer
QQE Oscillator (RSI 14, factor 4.238) detects momentum extremes and smooths noise more than a raw RSI, making it better suited for multi-time-frame use.
Consecutive-Candle Counter (default 8) highlights potential exhaustion after extended unidirectional moves; reversal symbols appear only if QQE divergence also exists.
Volatility-Adjusted Risk Line
ATR Trailing Stop (ATR 21, dynamic multiplier) expands in high volatility and tightens in low volatility, offering an adaptive exit reference rather than a fixed-tick stop.
Multi-Time-Frame Confirmation
The script automatically chooses a higher aggregation (e.g., 4 × the chart timeframe) and requires primary-trend agreement before issuing “Long ▲+” or “Short ▼+” confirmations. This guards against false signals during counter-trend rebounds.
Recommended parameters
RSI Length: 14 (QQE calculation base)
QQE Factor: 4.238 (Fibonacci-based multiplier)
ATR Period: 21 (volatility measurement)
EMA Lengths: Configurable short (5,8,20,34) and long (9,13,21,50) periods
Consecutive Candles: Selectable count (8)
Multi-timeframe Filter: Filter is enabled by default, resulting in more accurate signals.
Filters
The multi-timeframe filter enhances signal reliability by confirming trends across higher timeframes. This prevents counter-trend trades by ensuring alignment between current chart timeframe and broader market direction. The filter automatically calculates appropriate higher timeframes for trend confirmation.
Signals & Alerts
The indicator system exports multiple alert signals, and you can easily alert for any signal.
Up Trend : Primary long signal appears
Long - ▲ : Buy signal appears
Long - ▲+ : Confirmation buy signal appears
Long - ● : Primary reversal signal appears
Long - ☓ : Secondary reversal signal appears
Down Trend : Primary short signal appears
Short - ▼ : Sell signal appears
Short - ▼+ : Confirmation sell signal appears
Short - ● : Primary reversal signal appears
Short - ☓ : Secondary reversal signal appears
Originality & Value for Traders
Integrated scoring logic ensures signals fire only when trend, momentum, and volatility metrics corroborate, reducing “indicator conflict”.
Auto-computed MTF pairs mean no manual timeframe juggling.
Weight-balanced QQE/EMA blend creates smoother trend clouds than standard MA crosses, yet remains more responsive than Keltner or Donchian approaches.
One-click beginner profile plus full parameter access supports both novice and advanced users.
Risk Disclaimer
Use with Caution: This indicator is provided for educational and informational purposes only and should not be considered as financial advice. Users should exercise caution and perform their own analysis before making trading decisions based on the indicator's signals.
Not Financial Advice: The information provided by this indicator does not constitute financial advice, and the creator (Pineify) shall not be held responsible for any trading losses incurred as a result of using this indicator.
Backtesting Recommended: Traders are encouraged to backtest the indicator thoroughly on historical data before using it in live trading to assess its performance and suitability for their trading strategies.
Risk Management: Trading involves inherent risks, and users should implement proper risk management strategies, including but not limited to stop-loss orders and position sizing, to mitigate potential losses.
No Guarantees: The accuracy and reliability of the indicator's signals cannot be guaranteed, as they are based on historical price data and past performance may not be indicative of future results.

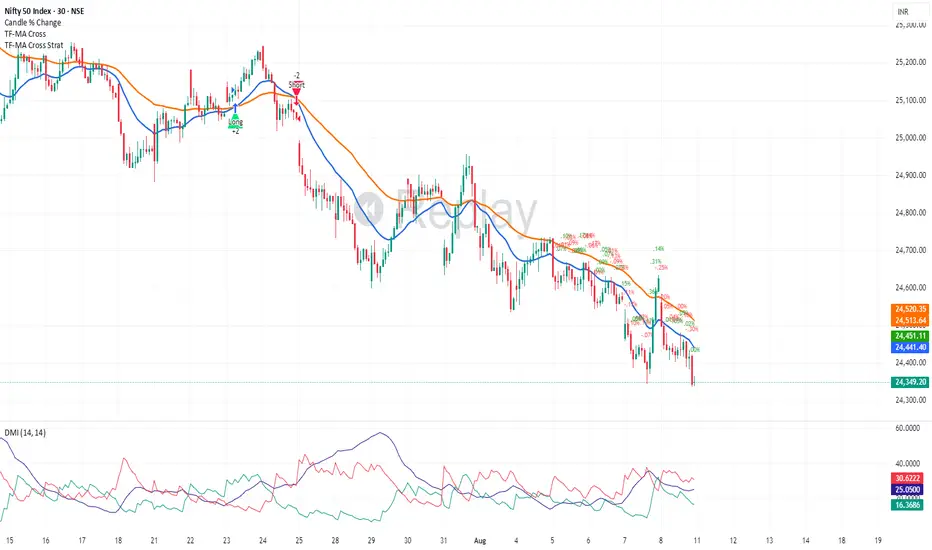
Three ma cross alertThis indicator displays three moving averages and can set alarms.
The default values for the three moving averages are set to 20,35,60, which can be changed by the user.
It is based on the idea of considering the moving average as an up-trend when it is in a positive arrangement and a down-trend when it is in a reverse arrangement.
If the candle reaches each moving average when the moving average is in a positive arrangement, it is considered a price adjustment
Therefore when the candles touch each line with the ma in the same arrangement, an alarm occurs.
The alarm reference time zone is set by 1D default, , and can be modified from the settings.
You can use it when you want to see the simple 3 moving averages without an alarm.
The alarm occurs before the closing price of the candle is closed in real time.
If there is any improvement, please contact us
Thanks

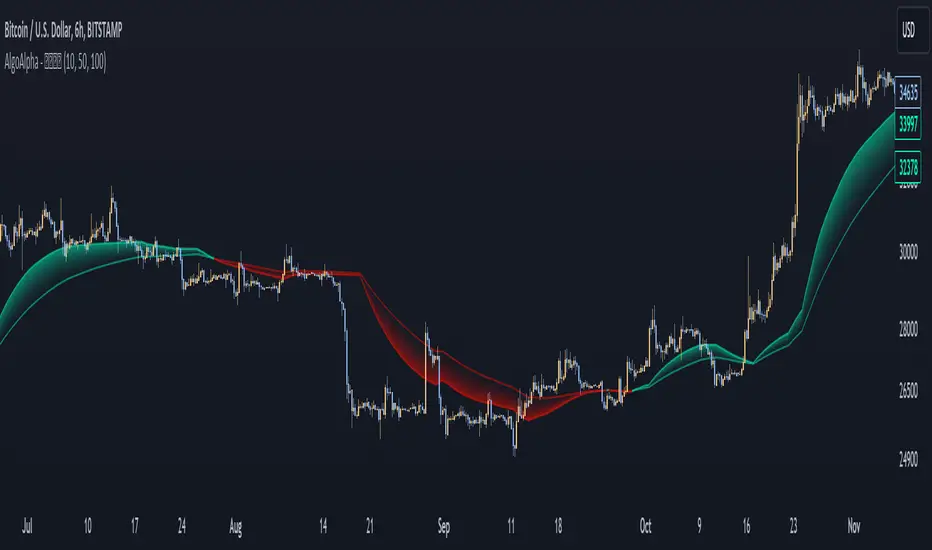
Liquidity Weighted Moving Averages [AlgoAlpha]Description:
The Liquidity Weighted Moving Averages by AlgoAlpha is a unique approach to identifying underlying trends in the market by looking at candle bars with the highest level of liquidity. This script offers a modified version of the classical MA crossover indicator that aims to be less noisy by using liquidity to determine the true fair value of price and where it should place more emphasis on when calculating the average.
Rationale:
It is common knowledge that liquidity makes it harder for market participants to move the price of assets, using this logic, we can determine the coincident liquidity of each bar by looking at the volume divided by the distance between the opening and closing price of that bar. If there is a higher volume but the opening and closing prices are near each other, this means that there was a high level of liquidity in that bar. We then use standard deviations to filter out high spikes of liquidity and record the closing prices on those bars. An average is then applied to these recorded prices only instead of taking the average of every single bar to avoid including outliers in the data processing.
Key features:
Customizable:
Fast Length - the period of the fast-moving average
Slow Length - the period of the slow-moving average
Outlier Threshold Length - the period of the outlier processing algorithm to detect spikes in liquidity
Significant Noise reduction from outliers:
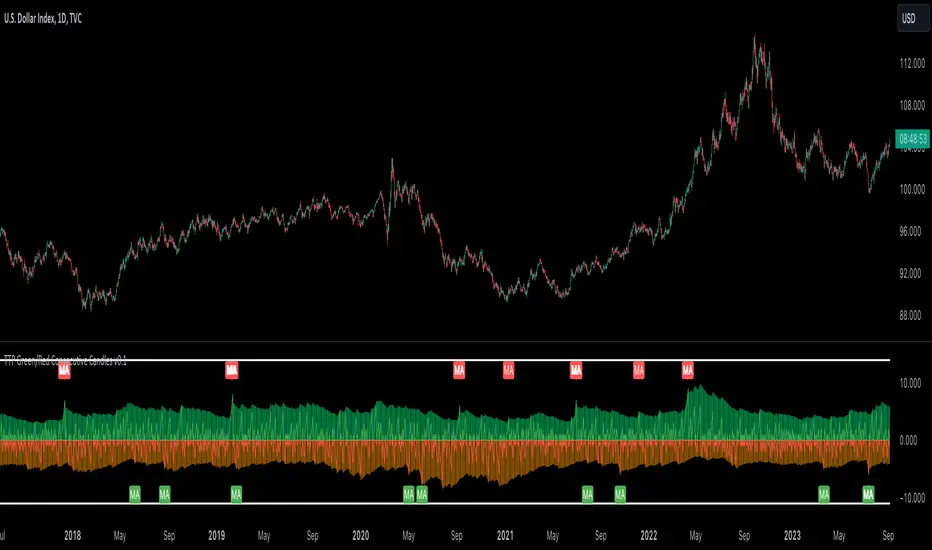
TTP Green/Red Consecutive CandlesThis indicator counts consecutive green/red candles offering some basic statistics and signals/alerts.
Features
- Counts consecutive green/red candles in an oscillator chart
- Moving average of the counting helps spotting when the consecutive candles are away from the mean. MA length and multiplier to adjust the signal sensitivity.
- Thresholds can be set to backtest and send alerts on any number of arbitrary consecutive candles of the same color.
- All time highs: the indicator keeps track of when the maximum has been reached
- Distribution data: the number of times each number of consecutive color candles has been reached is offered
Signals
- Threshold signal triggers when the number of candles of the same color is above the specified threshold.
- MA cross signal triggers when the number of candles of the same color is above the MA.
Korea pump kairiIn crypto assets, illiquid coins are often pumped on Korean exchanges.
The purpose of this indicator is to show the price deviation of the three symbols xxx/USDT Spot, xxx/USD Perpetual and xxx/KRW in terms of USD.
The xxx/USD Spot is set to a base value of 0 and the indicator shows how much the xxx/USD Perpetual and xxx/KRW Spot deviate from it.
Example of use)
Binance XEM/USDT Spot
Binance XEM/USDT Perp.
Upbit XEM/KRW Spot
For xxx/usd perp, SMA and, optionally, MA cross can also be displayed.
And for KRW/USD and USDT/USD, you can use the defaults as they are, or you can set your preferred symbols.

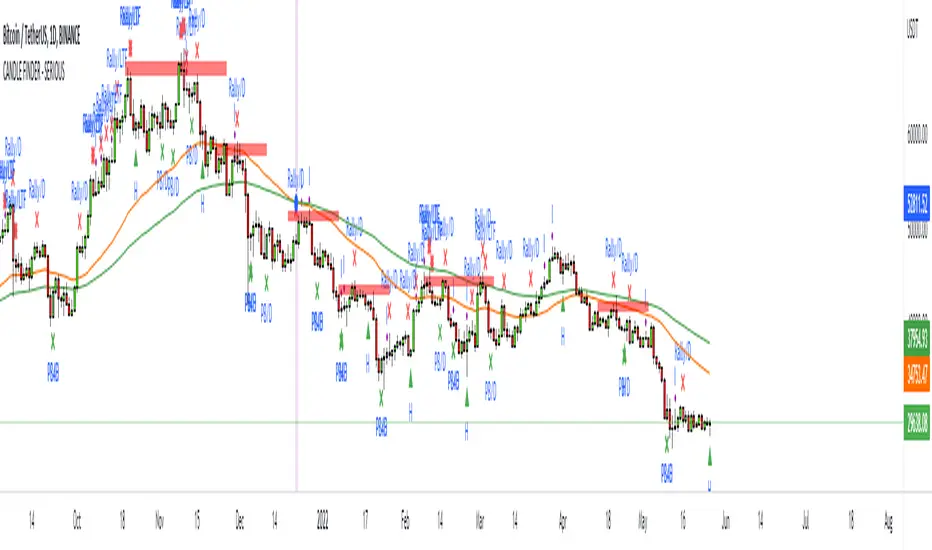
CANDLE FILTER Todays scripts is based on my Pullback And Rally Candles with other meaningful candles such as Hammers and Dojis.
You can choose which Candles to show on the cart and if you want to candles to appear above or below a moving average.
If you follow my work, you may recognise some of these candles which I'm about to show you however these candles are 1) more refined and 2) has moving average filters.
Ive included a D,6H,1H Candle in this script as on different timeframes - each swing low on average has a different amount of bars within the swing low / swing high so the DPB and RD will only work on the Daily
//Pullback candle
This candle is very powerful when used with simple Price Action such as Market Structure//Demand zones and support zones. (((((WORKS BEST IN UPTRENDS AND BOTTOM OF RANGES)))))
Ive included a D,6H,1H Pullback Candle in this script as on different timeframes - each swing low on average has a different amount of bars within the swing low so the DPB will only work on the Daily
//DAILY PULLBACK (Swing Traders)
snapshot
//4H PULLBACK (Swing Traders)
snapshot
- this signal will produce more signals due to the swing low filter on the 4H
//1H PULLBACK
snapshot
- this signal has been refined due to too many candle displaying in weak areas
!!!IF YOU DONT WANT TO USE PULLBACKS DURING DOWNTRENDS THEN USE THE EMA FILTER TO TURN OFF THE PULLBACKS WHEN PRICE IS BELOW THE MOVING AVERAGE!!!
//Rally candle (My personal Favourite) (((((WORKS BEST IN DOWNTRENDS AND TOP OF RANGES)))))
This candle is very powerful when used with simple Price Action such as Market Structure//Supply zones and Resistance zones.
//DAILY RALLY(Swing Traders)
snapshot
//4H RALLY(Swing Traders)
snapshot
- this signal will produce more signals due to the swing high filter on the 4H
!!!IF YOU DONT WANT TO USE RALLIES DURING UPTRENDSTHEN USE THE EMA FILTER TO TURN OFF THE RALLIES WHEN PRICE IS ABOVE THE MOVING AVERAGE!!!
//POWERFUL DOJIS (INDECISION)
snapshot
We look for indecision in key areas to see if momentum is shifting. When combined with Pullbacks or Rallys - this will enhance the odds of a probably area.
//HAMMERS
snapshot
//MOVING AVERAGES
snapshot
Short EMA = 50
Long EMA = 200
This filter can be used when the market is trending - look out for rejections off the moving averages
Also you can chance the Short And Long EMA to choose which MA cross you want to use
snapshot
ALSO ALL THE CANDLES HAVE A ALERT CONDITIONS WHICH YOU CAN ACCESS - THIS WILL ALERT ANY CANDLE YOU CHOOSE
Please leave a like/comment on this post as this is much appreciated....

ULTIMATE CANDLESTICK FINDER (Pullback/Rallys/Hammers/Dojis) + MATodays scripts is based on my Pullback And Rally Candles with other meaningful candles such as Hammers and Dojis.
You can choose which Candles to show on the cart and if you want to candles to appear above or below a moving average.
If you follow my work, you may recognise some of these candles which I'm about to show you however these candles are 1) more refined and 2) has moving average filters.
Ive included a D,6H,1H Candle in this script as on different timeframes - each swing low on average has a different amount of bars within the swing low / swing high so the DPB and RD will only work on the Daily
//Pullback candle
This candle is very powerful when used with simple Price Action such as Market Structure//Demand zones and support zones. (((((WORKS BEST IN UPTRENDS AND BOTTOM OF RANGES)))))
Ive included a D,6H,1H Pullback Candle in this script as on different timeframes - each swing low on average has a different amount of bars within the swing low so the DPB will only work on the Daily
//DAILY PULLBACK (Swing Traders)
//4H PULLBACK (Swing Traders)
- this signal will produce more signals due to the swing low filter on the 4H
//1H PULLBACK
- this signal has been refined due to too many candle displaying in weak areas
!!!IF YOU DONT WANT TO USE PULLBACKS DURING DOWNTRENDS THEN USE THE EMA FILTER TO TURN OFF THE PULLBACKS WHEN PRICE IS BELOW THE MOVING AVERAGE!!!
//Rally candle (My personal Favourite) (((((WORKS BEST IN DOWNTRENDS AND TOP OF RANGES)))))
This candle is very powerful when used with simple Price Action such as Market Structure//Supply zones and Resistance zones.
//DAILY RALLY(Swing Traders)
//4H RALLY(Swing Traders)
- this signal will produce more signals due to the swing high filter on the 4H
!!!IF YOU DONT WANT TO USE RALLIES DURING UPTRENDSTHEN USE THE EMA FILTER TO TURN OFF THE RALLIES WHEN PRICE IS ABOVE THE MOVING AVERAGE!!!
//POWERFUL DOJIS (INDECISION)
We look for indecision in key areas to see if momentum is shifting. When combined with Pullbacks or Rallys - this will enhance the odds of a probably area.
//HAMMERS
//MOVING AVERAGES
Short EMA = 50
Long EMA = 200
This filter can be used when the market is trending - look out for rejections off the moving averages
Also you can chance the Short And Long EMA to choose which MA cross you want to use
ALSO ALL THE CANDLES HAVE A ALERT CONDITIONS WHICH YOU CAN ACCESS - THIS WILL ALERT ANY CANDLE YOU CHOOSE
Please leave a like/comment on this post as this is much appreciated....